
This is the third publication of the Market’s Compass US Index and Sector ETF Study that is being released on my Substack Blog. This is the last US Index and Sector ETF Study that will be available to free subscribers. This week’s blog highlights the technical changes of the 30 US ETFs that we track on a weekly basis. There are three ETF Studies that include the Market’s Compass US Index and Sector ETF Study, the Developed Markets Country (DMC) ETF Study and the Emerging Markets Country (EMC) ETF Study. The three Studies will individually be published every three weeks. The DMC ETF Study will be published next week. As always we suggest readers view the ETF Studies on a lap top, Ipad or desk top computer.
This Week’s and 8 Week Trailing Technical Rankings of the 30 Individual ETFs
The Excel spreadsheet below indicates the weekly change in the Technical Ranking (“TR”) of each individual ETF. The technical ranking or scoring system is an entirely quantitative approach that utilizes multiple technical considerations that include but are not limited to trend, momentum, measurements of accumulation/distribution and relative strength. If an individual ETFs technical condition improves the Technical Ranking (“TR”) rises and conversely if the technical condition continues to deteriorate the “TR” falls. The “TR” of each individual ETF ranges from 0 to 50. The primary take away from this spread sheet should be the trend of the individual “TRs” either the continued improvement or deterioration, as well as a change in direction. Secondarily a very low ranking can signal an oversold condition and conversely a continued very high number can be viewed as an overbought condition but with due warning over sold conditions can continue at apace and overbought securities that have exhibited extraordinary momentum can easily become more overbought. A sustained trend change needs to unfold in the “TR” for it to be actionable.
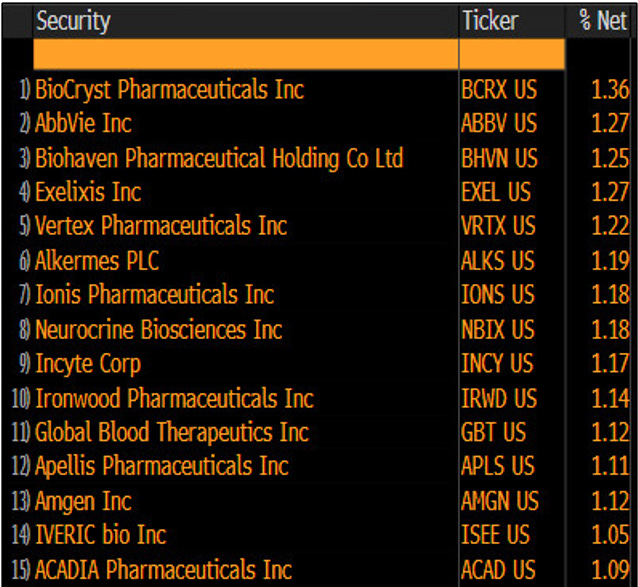
Three weeks ago, we brought attention to the poor technical condition of the SPDR S&P Biotech ETF (XBI). This week the XBI was the only ETF that garnered a sub-fifteen reading adding to the twelve-week run of sub-fifteen readings (Excel Spreadsheet above). This was despite last week’s +2.63% price rally in the ETF. At the risk of repetition, we are presenting an updated chart below. Note that relative to the SPX (bottom panel) there has been nary a hint of improvement relative to the large cap index. Following the price chart are the top 15 holdings in the ETF.
The Technical Condition Factors
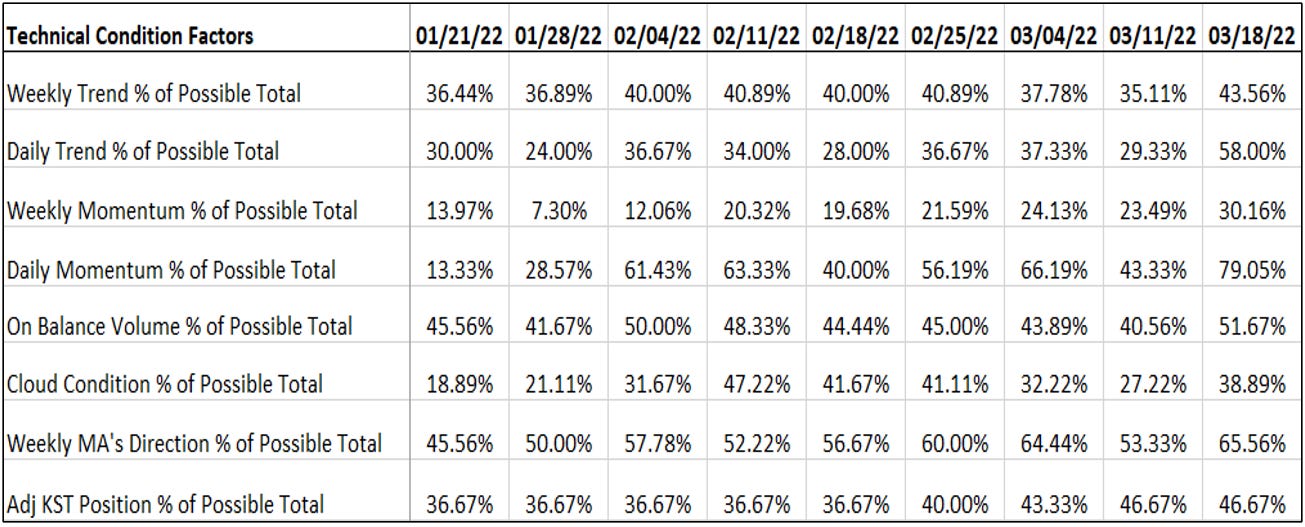
There are eight Technical Condition Factors (“TCFs”) that determine individual TR scores (0-50). Each of these 8 TCFs ask objective technical questions (see the spreadsheet posted below). If a technical question is positive an additional point is added to the individual TR. Conversely if the technical question is negative, it receives a “0”. A few TCFs carry more weight than the others such as the Weekly Trend Factor and the Weekly Momentum Factor in compiling each individual TR of each of the 30 ETFs. Because of that, the excel sheet below calculates each factor weekly reading as a percent of the possible total. For example, there are 7 considerations (or questions) in the Daily Momentum Condition (“DMC”) of the 30 ETFs (or 7 X 30) for a possible range of 0-210 if all 30 ETFs had fulfilled the DMC criteria the reading would be 210 or 100% . This past week a 79.05% reading of the DMC was registered, or 166 of a possible total of 210 positive points. One technical take away would be if the DMC rises to an extreme between 85% and 100% it would suggest a short term over bought condition was developing. Conversely a reading in the range of 0% to 15% would suggest an oversold condition was developing. As a confirmation tool, if all eight TCFs improve on a week over week basis, more of the 30 ETF TCFs are improving confirming a broader market move higher (think of an advance/decline calculation).
The SPX Index with This Week’s Total ETF Ranking “TER” Overlayed
The “TER” Indicator is a total of all 30 ETF rankings and can be looked at as a confirmation/divergence indicator as well as an overbought oversold indicator. As a confirmation/divergence tool: If the broader market as measured by the SPX Index (SP) continues to rally without a commensurate move or higher move in the “TER” the continued rally in the SPX Index becomes increasingly in jeopardy. Conversely, if the SPX Index continues to print lower lows and there is little change or a building improvement in the “TER” a positive divergence is registered. This is, in a fashion, is like a traditional A/D Line. As an overbought/oversold indicator: The closer the “TER” gets to the 1500 level (all 30 ETFs having a “TR” of 50) “things can’t get much better technically” and a growing number individual ETFs have become “stretched” the more of a chance of a pullback in the SPX Index, On the flip side the closer to an extreme low “things can’t get much worse technically” and a growing number of ETFs are “washed out technically” an oversold rally or measurable low is close to be in place. The 13-week exponential moving average in Red smooths the volatile “TR” readings and analytically is a better indicator of trend.
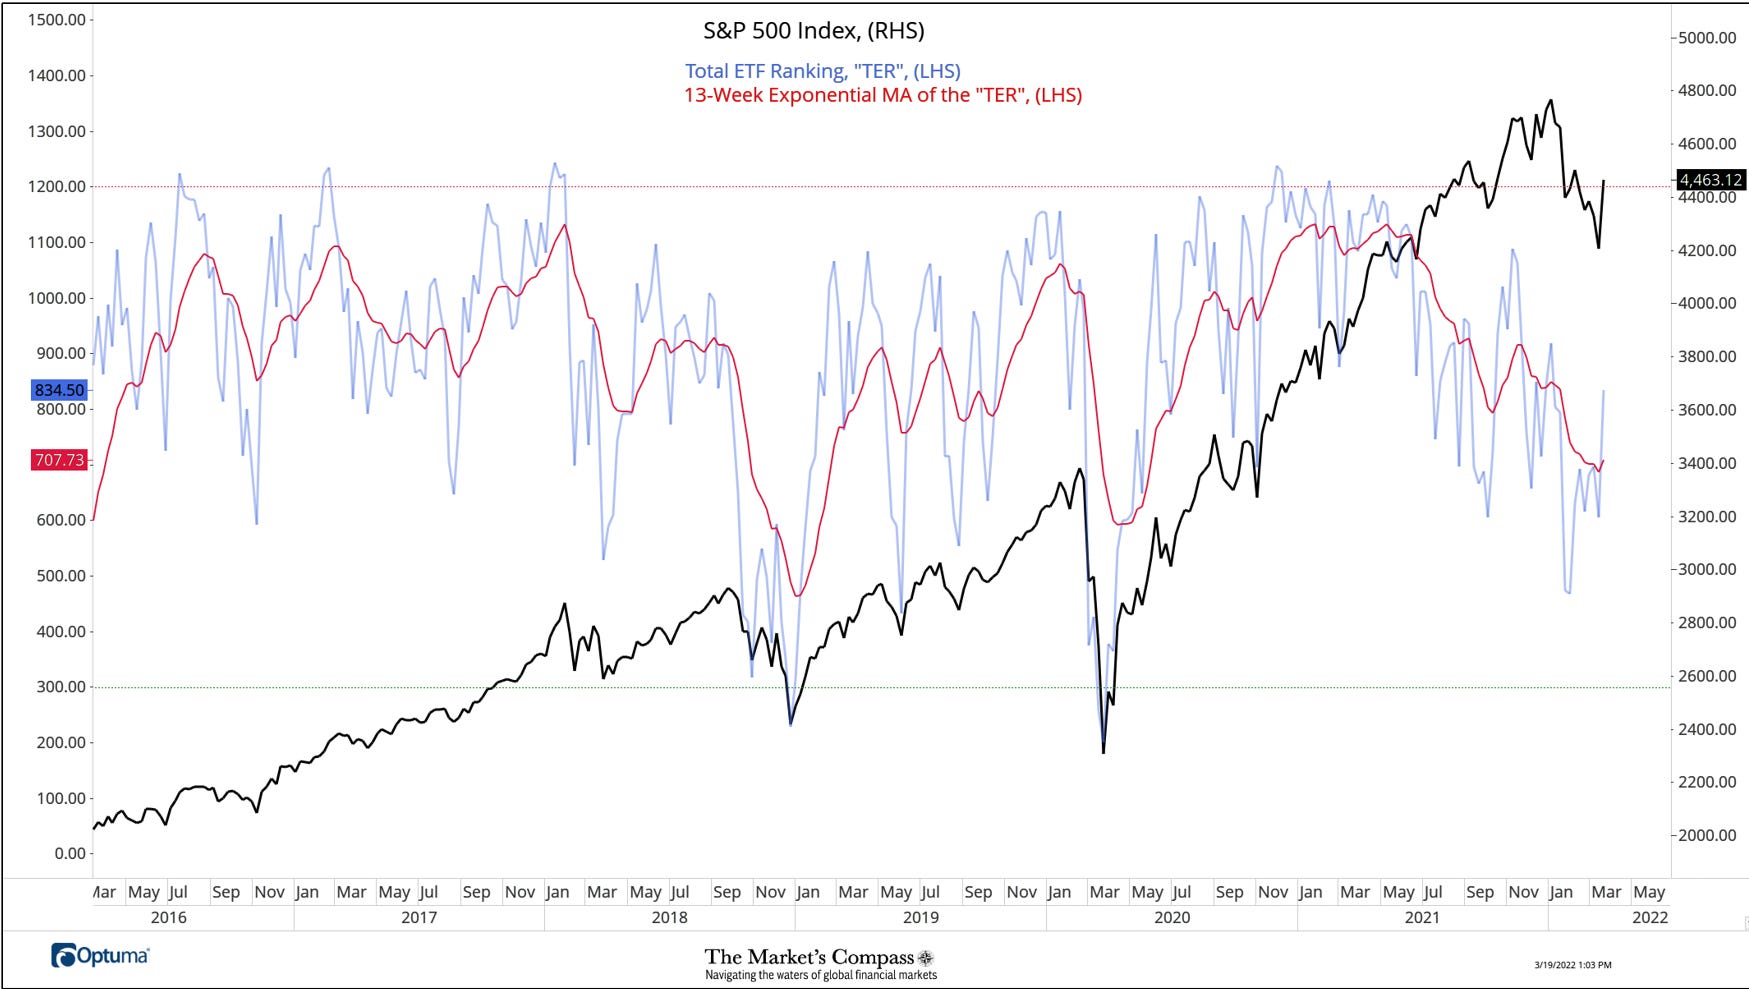
As can be seen above, the Total Technical Ranking (“TER”) rose to 834.5 from 604.5. The +38.05% gain in the TER was the best WoW change in the TER since the +55.36% WoW gain in the week ending 11/6/20 that marked the end of a sideways 3-month correction in the large cap index. As we have said before, the best way to analytically view the longer trend is to focus on the 13-week Exponential moving average (red line) which continues to track lower despite the recent minor hook higher and it should be noted that the TER has risen back above the moving average.
Short term thoughts on the technical condition of the SPX Index.
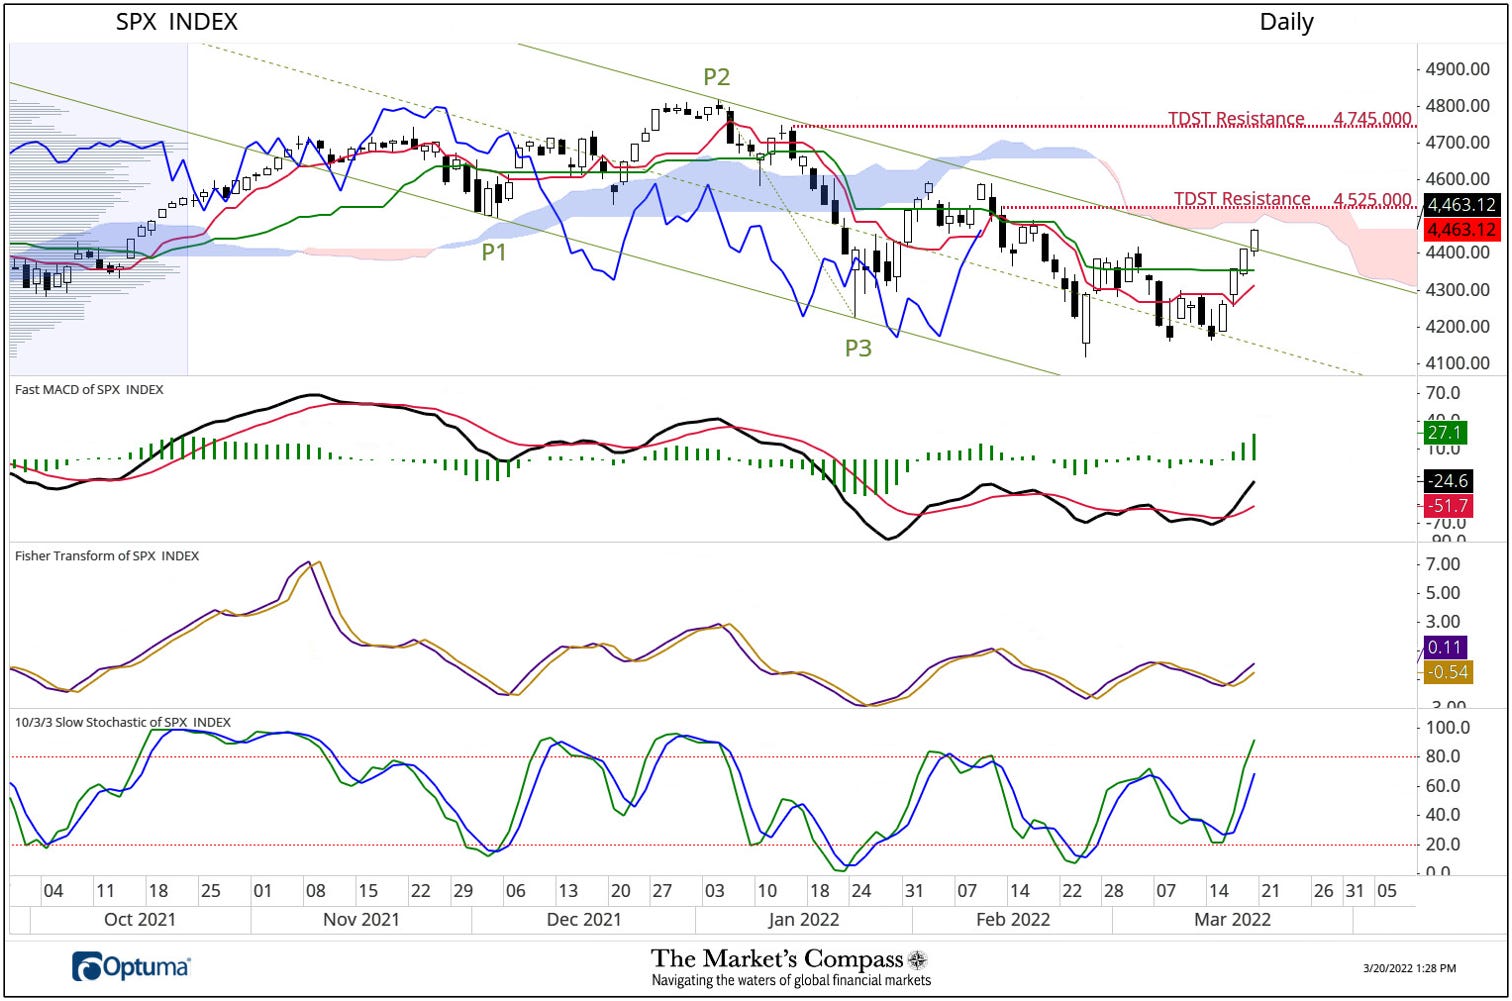
In a twitter post last Thursday we brought attention to the three white soldiers (chart above) and although they are not tall in stature or perfect, nor are their heads and bottoms “shaven”, the three day candle pattern was about to mount an attack on the Upper Parallel of the Schiff Modified Pitchfork. With Friday’s follow through rally the SPX overtook the Upper Parallel. The large cap index still has hurdles ahead in the form of TDST resistance and the Cloud (confluence of resistance can be formidable) but it appears from a glance at the momentum oscillators that the SPX has the wind at it back increasing the odds that it will be successful in overtaking both.
The Average Technical Ranking of the 30 US Index and Sector ETFs
The weekly Average Technical Ranking (“ATR”) is the average Technical Ranking (“TR”) of the 30 US Index and Sector ETFs we track. Like the “TER”, it is a confirmation/divergence or overbought/oversold indicator.
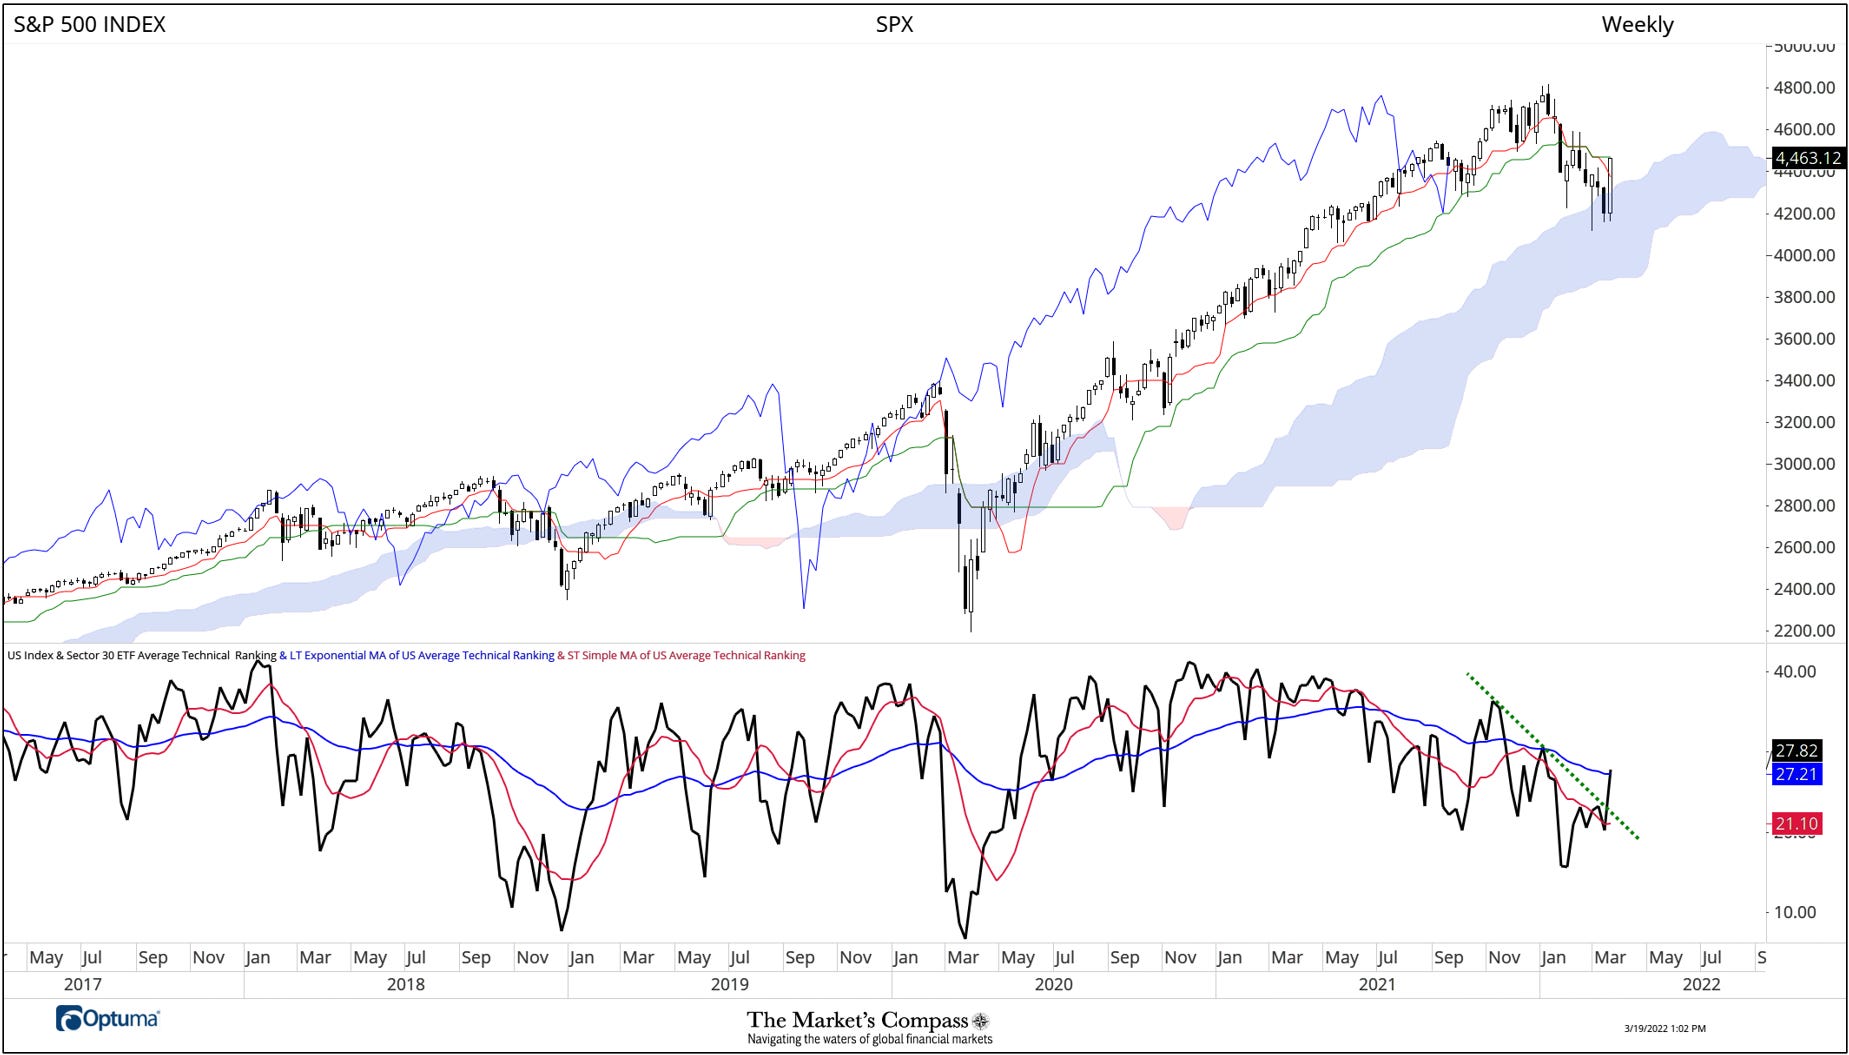
The SPX Index rallied +6.16% last week finding it’s way back above the Weekly Cloud closing just off the highs of the week although the advance has thus far been capped by the Kijun Plot (green line). That marked the best weekly gain since the November 6, 2000 weekly gain of 239.48 points or +7.32% that marked the end of a nine-week sideways price correction. The Average Technical Ranking (“ATR”) rose to 27.82 which marks the best level since the turn of the year. Although the ATR did not print a higher high it did breakout of the five month down trend (green dashed line) and it nudged its way just above the longer-term Exponential moving average (blue line).
The Week Over Week Change in Technical Rankings
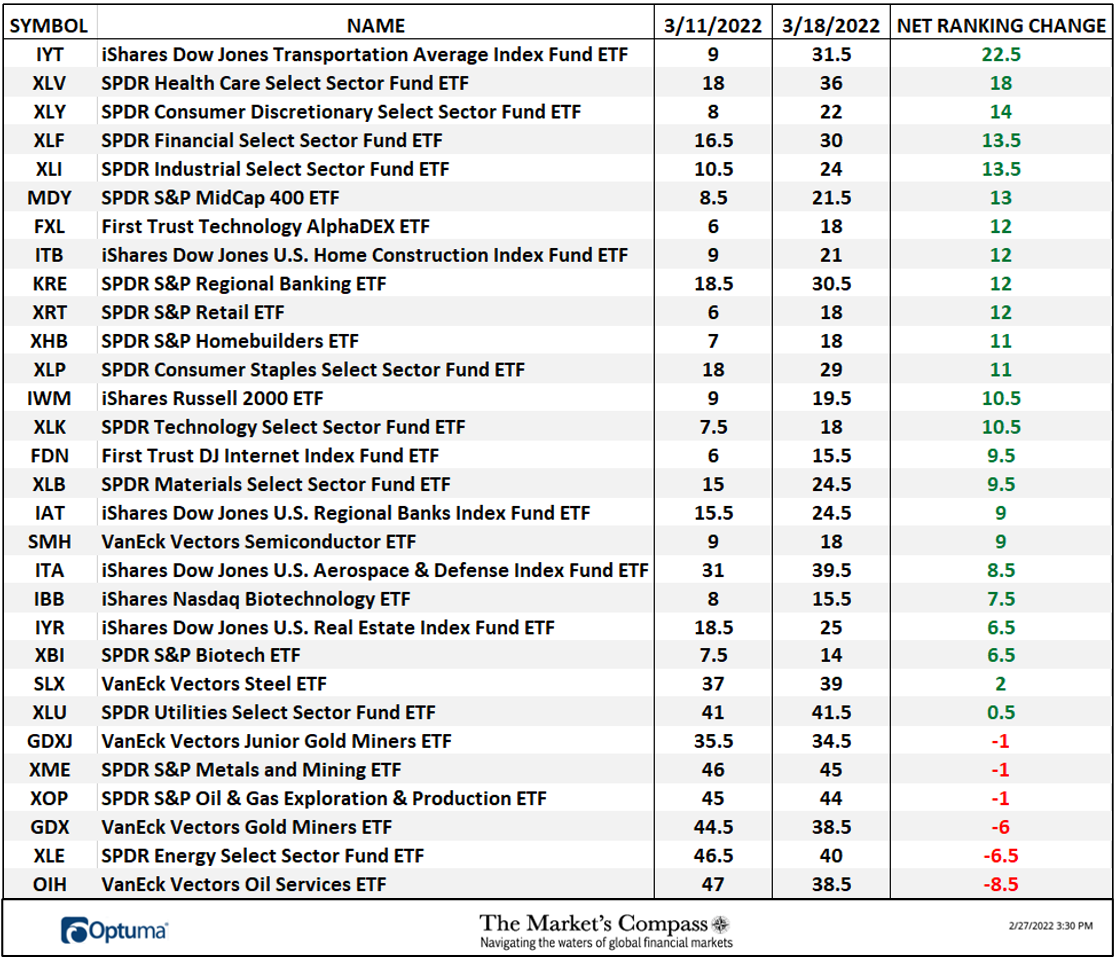
The largest gains in Technical Ranking (“TR”) changes week over week were in ETFs that had lagged the broader market as of late. The average TR change of +7.67 was the largest average gain in recent memory. Twenty-four ETFs saw gains in their TRs and 6 moved lower versus the previous week when 7 saw improved TRs, 3 were unchanged and 20 TRs moved low for an average TR change of -3.07%.
The Weekly Absolute and Relative Price % Change of the 30 ETFs*
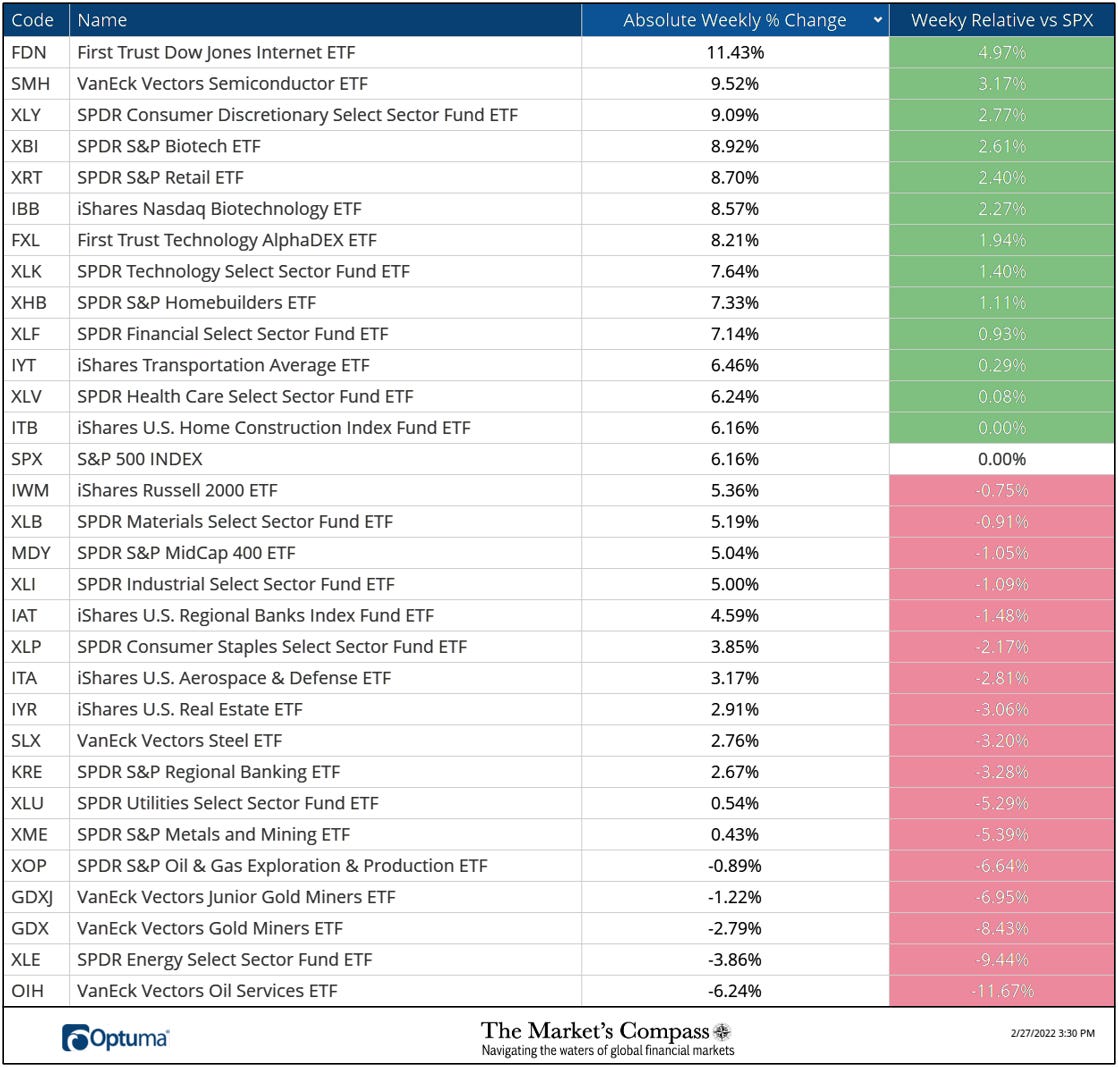
*Does not include dividends
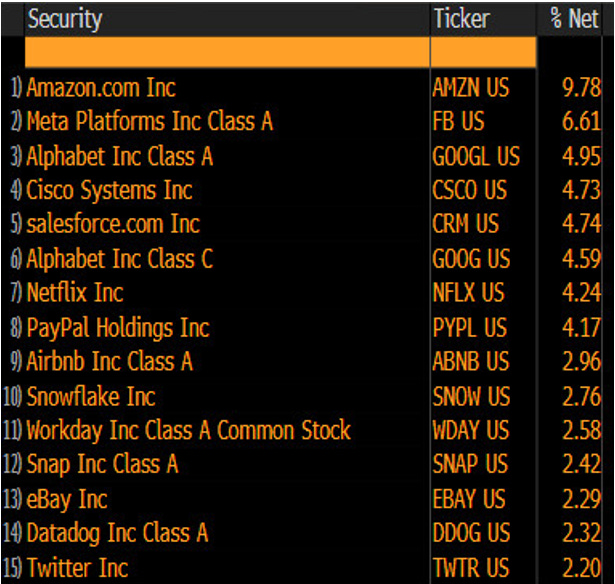
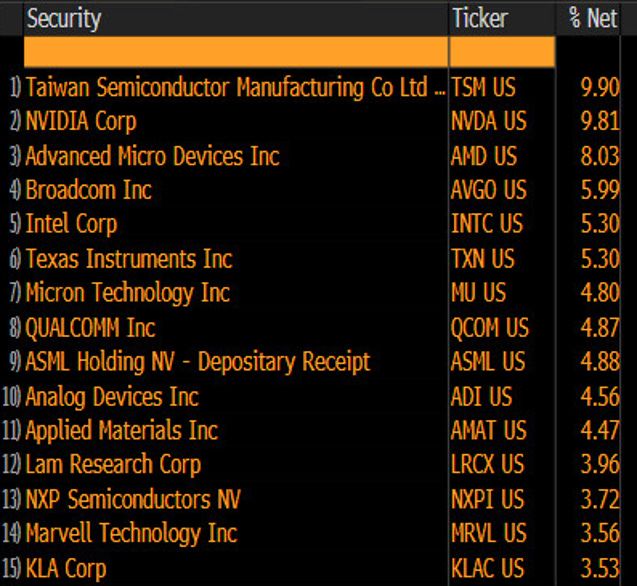
Twenty-five ETFs registered absolute gains on the week and 5 traded lower. The average absolute gain in the 30 ETFs was +4.45%. The two best absolute performing ETFs on the week were the First Trust Dow Jones Internet ETF (FDN) and the Van Eck Vectors Semiconductor ETF (SMH) up +11.43% and +9.52% respectively. As can be seen in the spread sheet above both ETFs ended Friday’s trading session with the strongest gains of the 30 U.S. ETFs we track in these pages. Both ETFs have seen a measurable turn in price momentum as witnessed the turn in MACD on the Daily charts of the ETFs below. The top 15 Members follow.
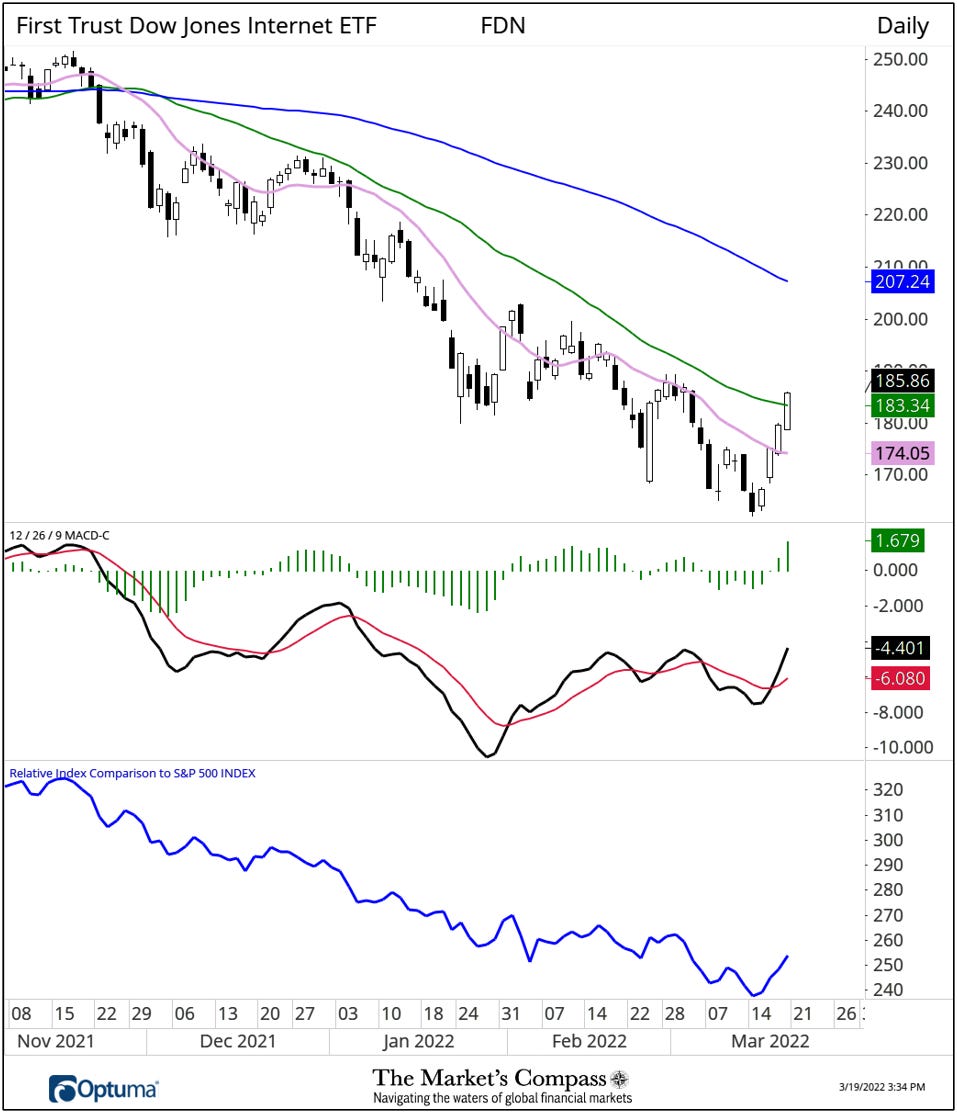
FDN Holdings
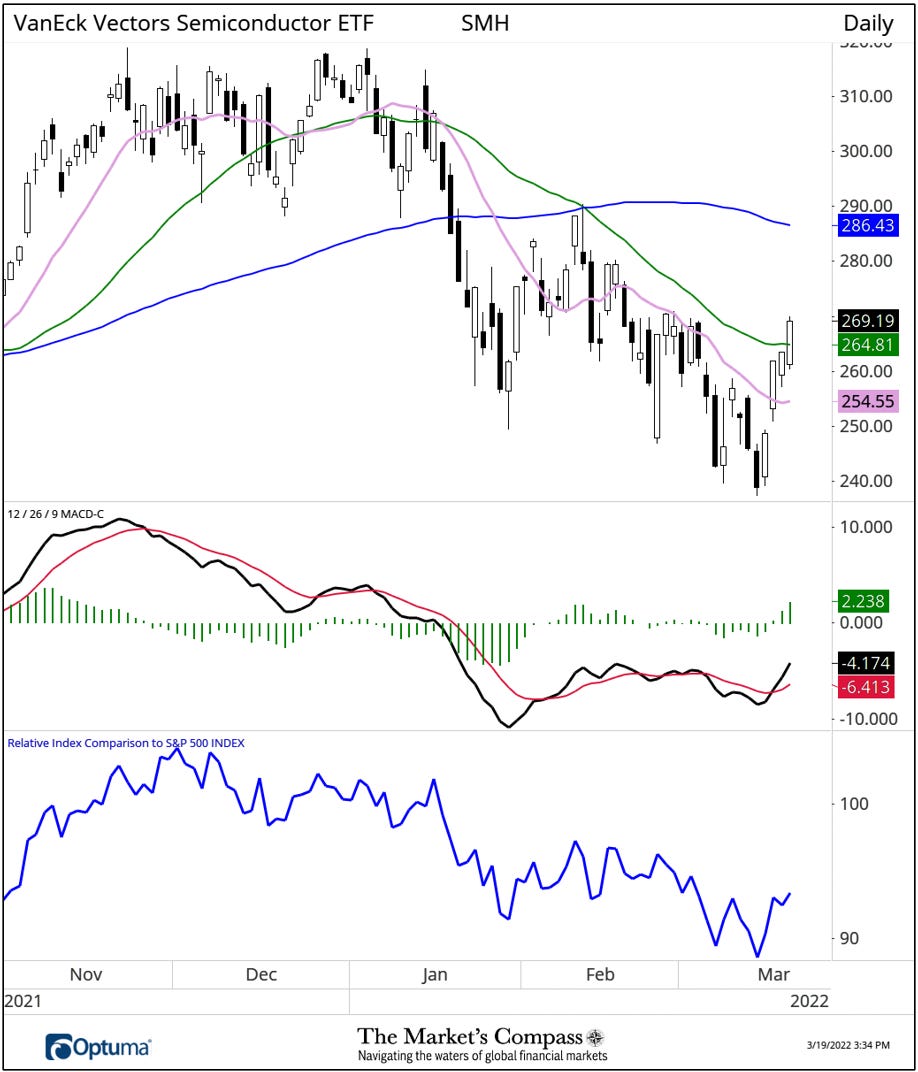
SMH Holdings
The Relative Return of the 30 ETFs Vs. the SPX Index Year to Date*
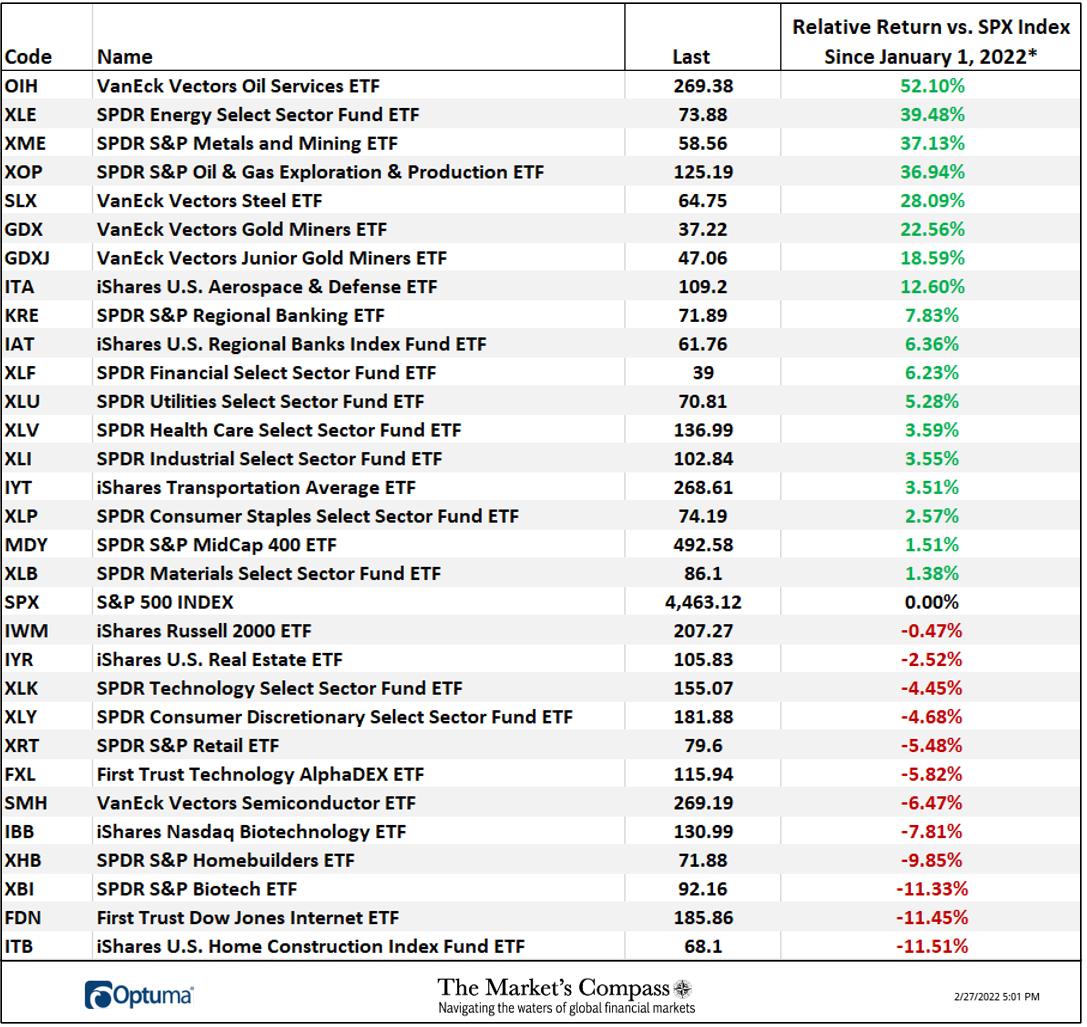
*Does not include dividends
All charts are courtesy of Optuma. All ETF holdings data is courtesy of Bloomberg. I invite our readers to contact me with any questions or comments at…tbrackett@themarketscompass.com